The curve in the report should be the curve of the equipment.
Most coordination charts that ship inside a test report were drawn from the design. They show what the devices were meant to do. The one thing a test report is uniquely able to say (what the devices actually did, on the day, at the settings they were found at) is the thing that usually does not make it onto the chart.
- Measured, not modelled
- Plotted from the trip points recorded during the test.
- Basic
- The lowest plan that includes it. In every plan above it too.
- Not a study
- It draws what was measured. It does not calculate settings or replace a coordination study.
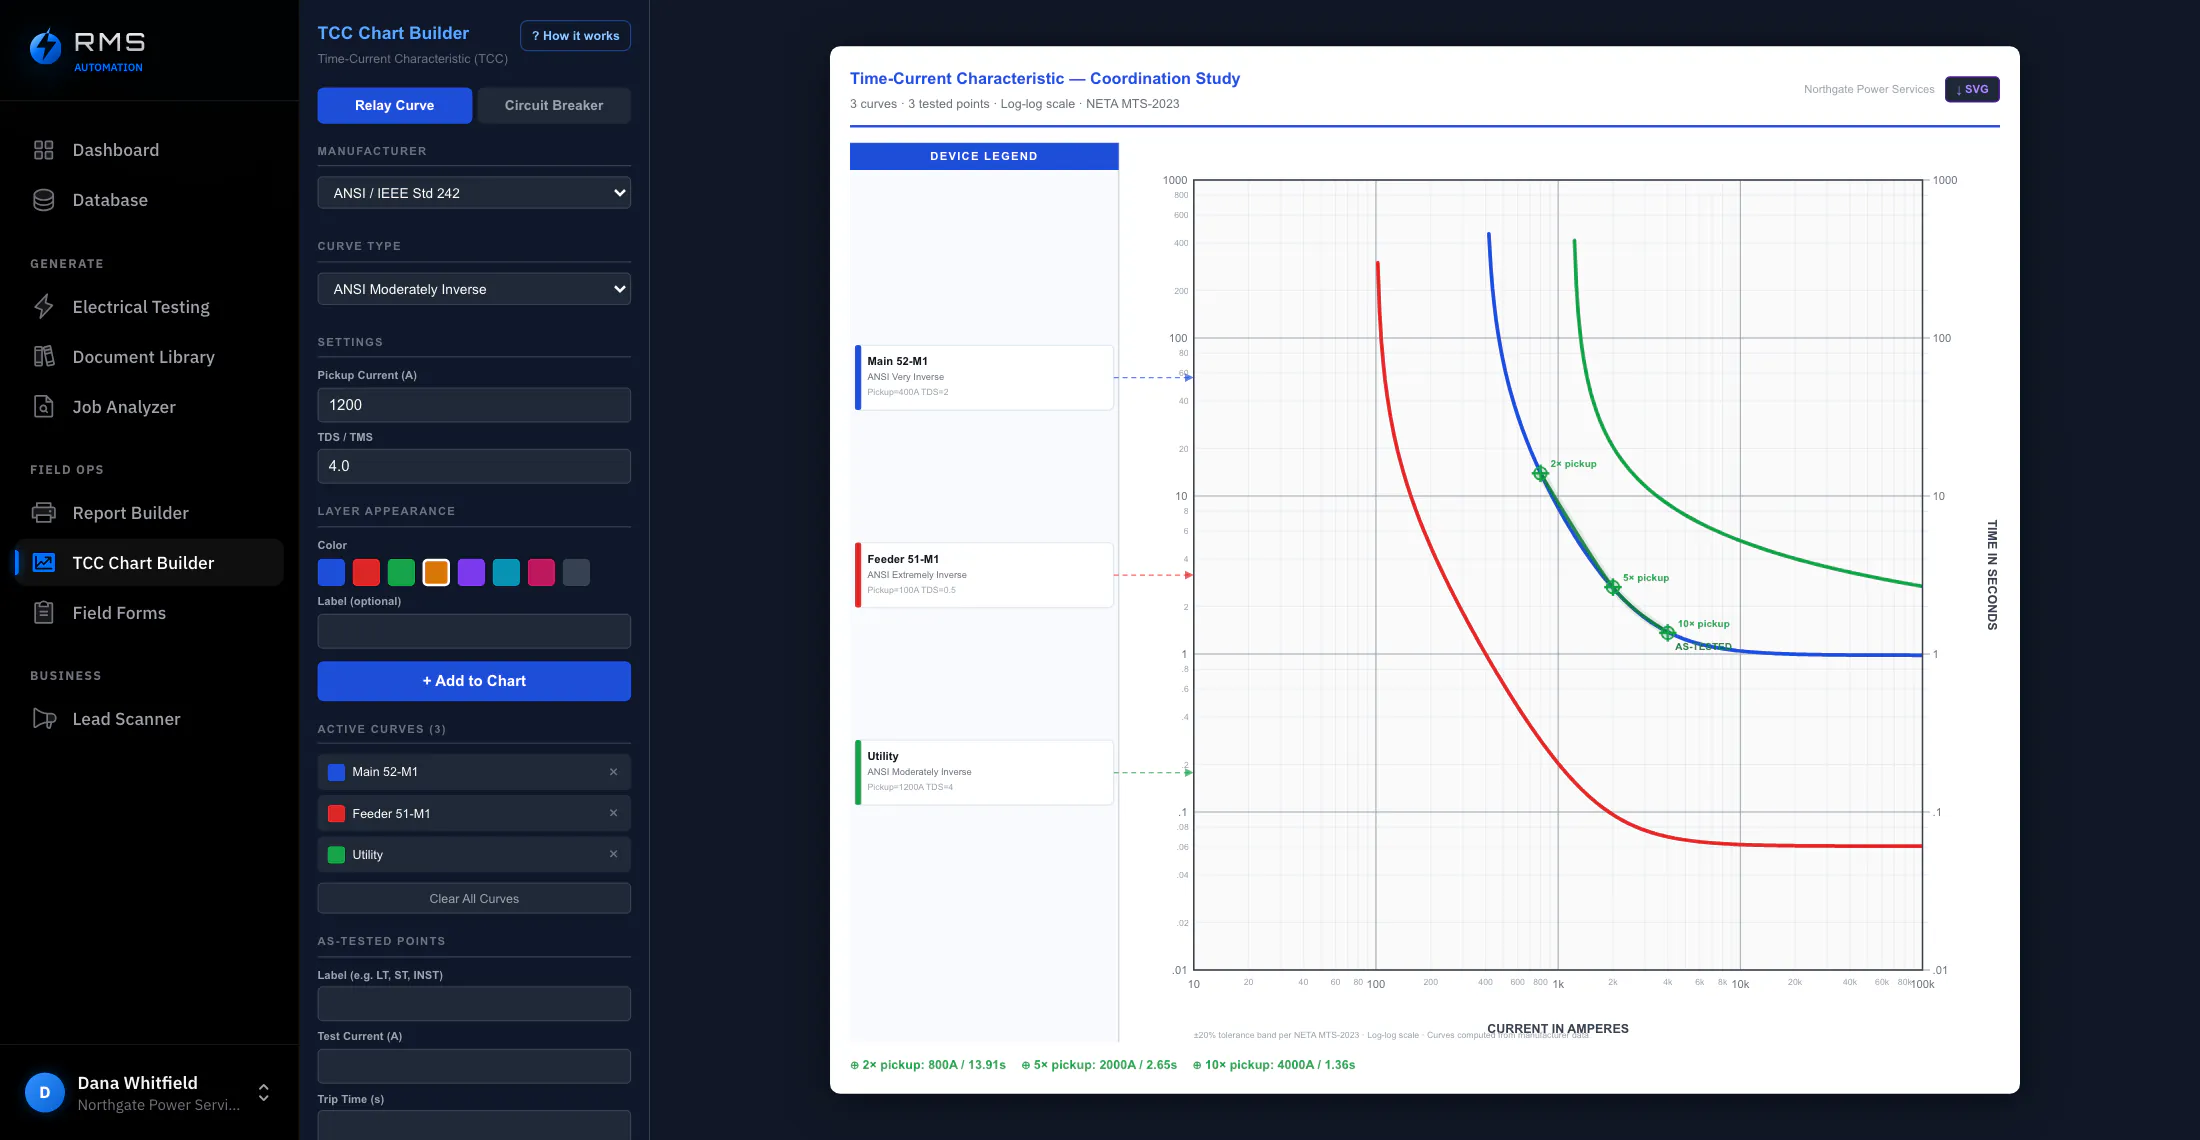
Curves drawn from what you measured
Secondary injection produces a set of points: at this multiple of pickup, the device opened in this many seconds. On most jobs those points end their life as a column of numbers in an appendix nobody plots.
Here they are the chart. Trip times recorded on the device form are plotted directly, so the curve in the report is a curve of measurements with the measurements still attached. Click a point and you are looking at the test that produced it, not a value someone re-typed into a drawing package.
- Plotted from the trip points already recorded on the job, no second entry
- Every plotted point traceable to the test that produced it
- Log-log axes, standard decades, readable when printed at report size
Against the manufacturer's published curve
A measured curve alone tells you the device did something. Laid over the published characteristic for that model at those settings, it tells you whether it did what it is supposed to do: and the gap between the two is the finding. A breaker whose points sit consistently at the slow edge of the band has not failed anything, but it has told you something about its condition: obvious on a chart, invisible in a table of seconds.
- Published characteristic plotted at the settings the device was found at
- Manufacturer tolerance band drawn, so “within spec” is something you can see rather than assert
- Upstream and downstream devices on one chart, in the order they sit in the system
Overlap you can see before the report goes out
When two devices in series can open on the same fault, the chart shows their curves crossing or touching. That is worth raising while the crew is still on site, not three weeks later when the report is read, and not two years later when a feeder fault takes out a main.
Overlapping regions are marked. To be exact about what that is: it is an observation about two plotted curves, not a coordination study. It does not know your available fault current, cable damage curves, transformer inrush or arcing-fault minimums. It is the thing that makes an engineer look.
- Overlapping regions marked where two series devices could operate together
- Raised while the job is open, not after the report is issued
- Exported into the report next to the test data it came from, in the same document
What it saves, and how to work it out
Not measured customer results. Every input below is an assumption, shown so you can replace it with your own figures. It is priced at an engineering rate rather than a field rate, because whoever redraws these curves today is usually not the person who measured them.
| Line | Value |
|---|---|
| Devices in a coordination set (assumed) | 6 |
| Building the set by hand in a general drawing tool (assumed) | 120 min |
| Plotting from measurements already on the job (assumed) | 20 min |
| Coordination sets per month (assumed) | 2 |
| Loaded engineering rate (assumed) | $125 / hr |
| Saved per set | 100 min · $208 |
| Saved over a year at two sets a month | 40 hr · $5,000 |
The number not in the table is the set that does not get drawn at all, because two hours of engineering time is not in the price of the job, which is why so many reports carry a table of trip times and no chart. At twenty minutes, the chart goes in every report.
Who it changes the day for
It puts you in the room with the engineers
A report that arrives with plotted, measured curves against published bands reads like it came from a firm with an engineering department, and it costs you twenty minutes. It also protects you: when a device operates badly six months later, the chart is the record of what it was doing when you left, and pointing at it is a different position from describing it.
Fleet-wide drift becomes visible
One measured curve is a finding about a device. Four hundred, plotted the same way against the same published bands, are a finding about a fleet, which models drift, at which sites, after how long in service. That only works if the charts are comparable; hand-drawn charts from six engineers in four tools are six sets of findings that cannot be added together.